Looking at competing events through a different lens in dementia research
L. Paloma-Rojas Saunero.
Epidemiology Department
Causal Inference, Neuro-Epi Group
Hello My name is Paloma Rojas-Saunero, I am a PhD candidate at Erasmus MC and today I will present my work called: Looking at competing events through a different lens.
Introduction
Whenever we study time-to-dementia, death challenges the research question and the analytical methods.
Introduction
Whenever we study time-to-dementia, death challenges the research question and the analytical methods.
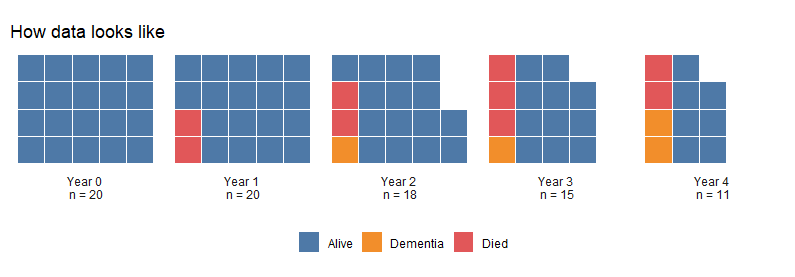
For example: if we have data on a cohort at baseline everyone was alive but by the first year 2 individuals, presented in red, have died. By the next time point, this subjects are eliminated from the dataset, and they can't longer develop dementia at year 2, year 3, year 4. As more subjects die over time, less subjects can be at risk of developing dementia.
Introduction
Whenever we study time-to-dementia, death challenges the research question and the analytical methods.
As subjects die over time, less subjects can be at risk of developing dementia (death is a competing event).
We can't consider that the ones who died are similar to the one's who stay in the cohort.
For example: if we have data on a cohort at baseline everyone was alive but by the first year 2 individuals, presented in red, have died. By the next time point, this subjects are eliminated from the dataset, and they can't longer develop dementia at year 2, year 3, year 4. As more subjects die over time, less subjects can be at risk of developing dementia.
Aims
- Demonstrate how two questions that consider death differently can lead to different results, using educational attainment, sex and APOE-ε4 as examples
For this reason I would like to first... second...
Aims
Demonstrate how two questions that consider death differently can lead to different results, using educational attainment, sex and APOE-ε4 as examples
Describe common practices in the analysis and interpretation of time-to-dementia through a systematic review
For this reason I would like to first... second...
Application to the Rotterdam Study
To answer our first aim, we worked with the Rotterdam Study Cohort and included participants from the first wave of inclusion between 1990-1993 and followed at different time points
Application to the Rotterdam Study
- Participants from Rotterdam Study I, recruited between 1990-1993 and followed during 1993-1995, 1997-1999 and 2002-2005
To answer our first aim, we worked with the Rotterdam Study Cohort and included participants from the first wave of inclusion between 1990-1993 and followed at different time points
Application to the Rotterdam Study
Participants from Rotterdam Study I, recruited between 1990-1993 and followed during 1993-1995, 1997-1999 and 2002-2005
No prior history of dementia diagnosis
Complete information at baseline
Final sample size of 5370 participants
Mean age at baseline of 66 years
783 individuals were lost to follow-up, 749 developed dementia and 1726 died
To answer our first aim, we worked with the Rotterdam Study Cohort and included participants from the first wave of inclusion between 1990-1993 and followed at different time points
Measurements
Measurements
- Lower educational attainment (primary education, lower or intermediate general education or lower vocational education) vs. Higher educational attainment (intermediate vocational education or higher general education and higher vocational education or university)
Measurements
Lower educational attainment (primary education, lower or intermediate general education or lower vocational education) vs. Higher educational attainment (intermediate vocational education or higher general education and higher vocational education or university)
Women vs men (based on self-reported questionnaire)
APOE-ε4 carrier (at least one ε4 allele) vs APOE-ε4 non-carriers
Outcome and Follow-up
Dementia diagnosis, Death, Lost to follow-up
Follow-up: 20 years since individual baseline
We measured and compared...
Methods
| Question | Methods | Key Assumptions on competing event | Interpretation |
|---|---|---|---|
| The risk of dementia regardless of death | Cause-specific cumulative incidence* or Fine and Gray subdistribution hazard | N/A | Part of the primary effect is through the effect between the exposure and death. Analogous to a total effect. |
Young J. et al. Stat Med. 2020
Let's review the different questions that can ask The first is the "...." and the methods that can answer this question are This question does not require any assumption on the competing event of death However, the interpretation can be tricky since part of the effect we see in dementia may be throug... For example, when we study the risk of smoking and dementia and we see a protective effect, it might be because smoking increases the risk of cancer.
Methods
| Question | Methods | Key Assumptions on competing event | Interpretation |
|---|---|---|---|
| The risk of dementia regardless of death | Cause-specific cumulative incidence* or Fine and Gray subdistribution hazard | N/A | Part of the primary effect is through the effect between the exposure and death. Analogous to a total effect. |
| The risk of dementia with elimination of death | Kaplan Meier estimate or Cause-specific hazard model | Death is uninformative, given available data* | The effect between exposure and dementia if we could prevent death. Analogous to a controlled direct effect. |
Young J. et al. Stat Med. 2020
- This question requires that we censor people that die, but this is not equivalent to ignoring
The second question we can ask is .... whenever we use KM or the cause-specific hazard model we are answering this question but this requires the strong assumption that, given the data death is uninformative. However, the challenge is that this q. is interpreted as.... which means, within a hypothetical scenario were we prevent death from happening.
In addition, to answer this question we need to censor...so lets see how we would do this
The risk of dementia regardless of death
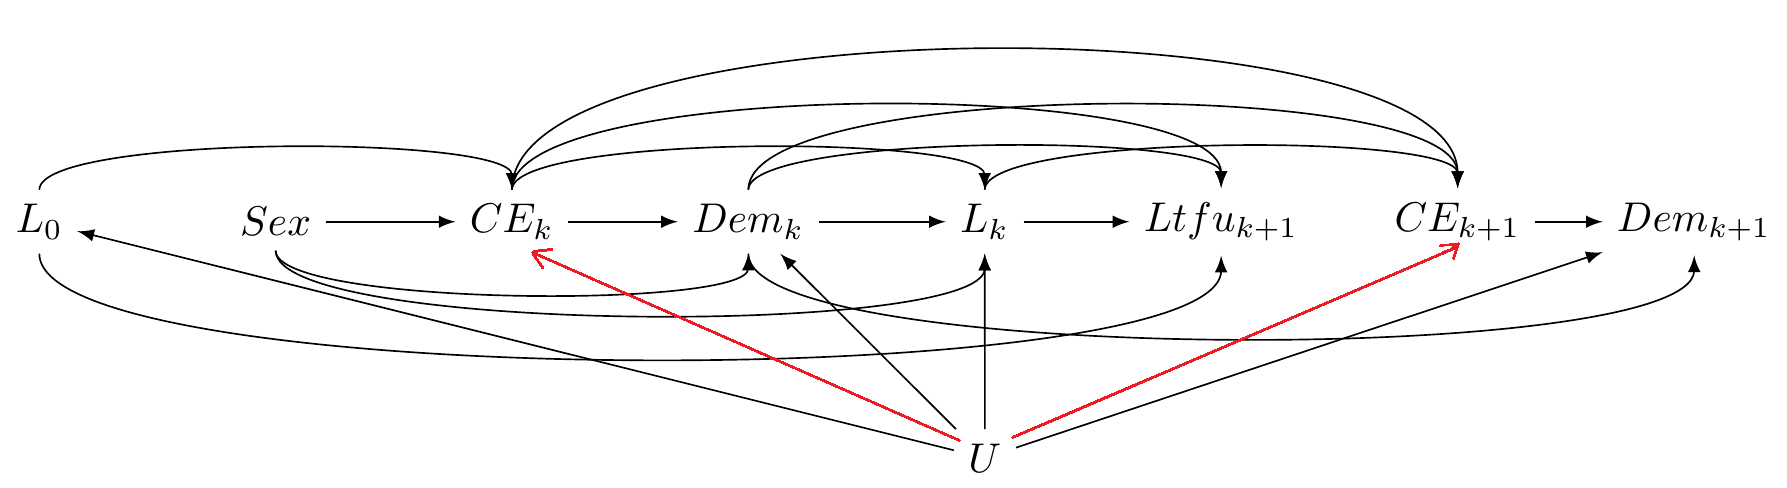
Pr[Dema,ltfu=0=1]
L0: baseline confounders
CEk: competing event death
Dem: dementia diagnosis
Lk: confounders
Ltfuk+1: Loss to follow-up
The risk of dementia eliminating death
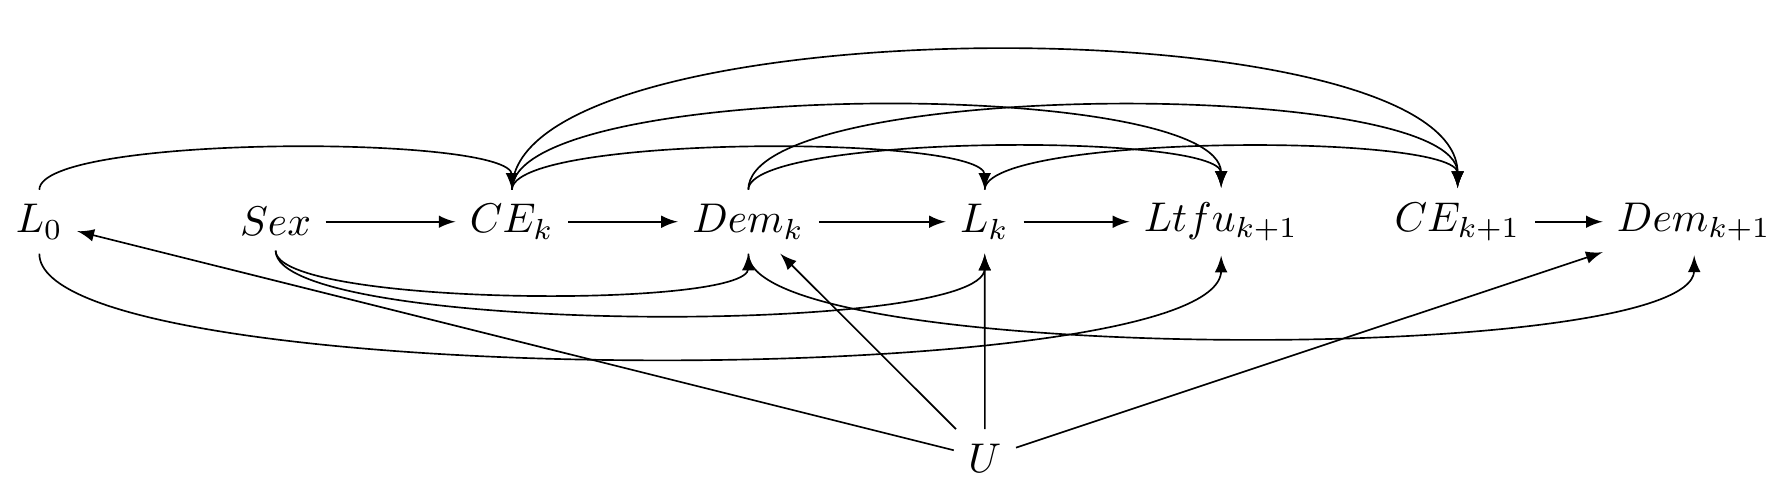
Pr[Dema,ltfu=0,ce=0=1]
L0: baseline confounders
CEk: competing event death
Dem: dementia diagnosis
Lk: confounders
Ltfuk+1: Loss to follow-up
Additional alternative research questions
- The combined risk of dementia or death
Additional alternative research questions
The combined risk of dementia or death
The risk of dementia if the exposure can be decomposed in different pathways (separable effects)*
*Stensrud M.J. et al. JASA. 2020
Additional alternative research questions
The combined risk of dementia or death
The risk of dementia if the exposure can be decomposed in different pathways (separable effects)*
*Stensrud M.J. et al. JASA. 2020
- The risk of dementia on a subgroup of individuals who would never experience the competing event (survivor average causal effect)
Statistical analysis
We used inverse probability weighting (IPW) of marginal structural models
Generalizable to time-dependent confounding and selection bias
Weights for lost to follow-up at each time point:
WLTFU=1/Pr[LTFU=0|L,A]Weights for the death at each time point:
WDeath=1/Pr[Death=0|L,A]
Statistical analysis
We used inverse probability weighting (IPW) of marginal structural models
Generalizable to time-dependent confounding and selection bias
Weights for lost to follow-up at each time point:
WLTFU=1/Pr[LTFU=0|L,A]Weights for the death at each time point:
WDeath=1/Pr[Death=0|L,A]
Regardless of death: WLTFU
Eliminating death: WLTFU∗WDeath
Statistical analysis
Weights using the following covariates:
Baseline: age, sex, APOE-ε4, education, history of heart disease
Time-updated: systolic blood pressure, BMI, smoking habit, development of diabetes, heart disease, stroke, cancer
Statistical analysis
Weights using the following covariates:
Baseline: age, sex, APOE-ε4, education, history of heart disease
Time-updated: systolic blood pressure, BMI, smoking habit, development of diabetes, heart disease, stroke, cancer
Standardized cumulative incidence curves
We present comparable estimands (risk difference, risk ratio)
95%CI were calculated through bootstrap
The advantage of this method is that we can also draw... and it gives... Now, let's see how the 2 questions can lead to different results
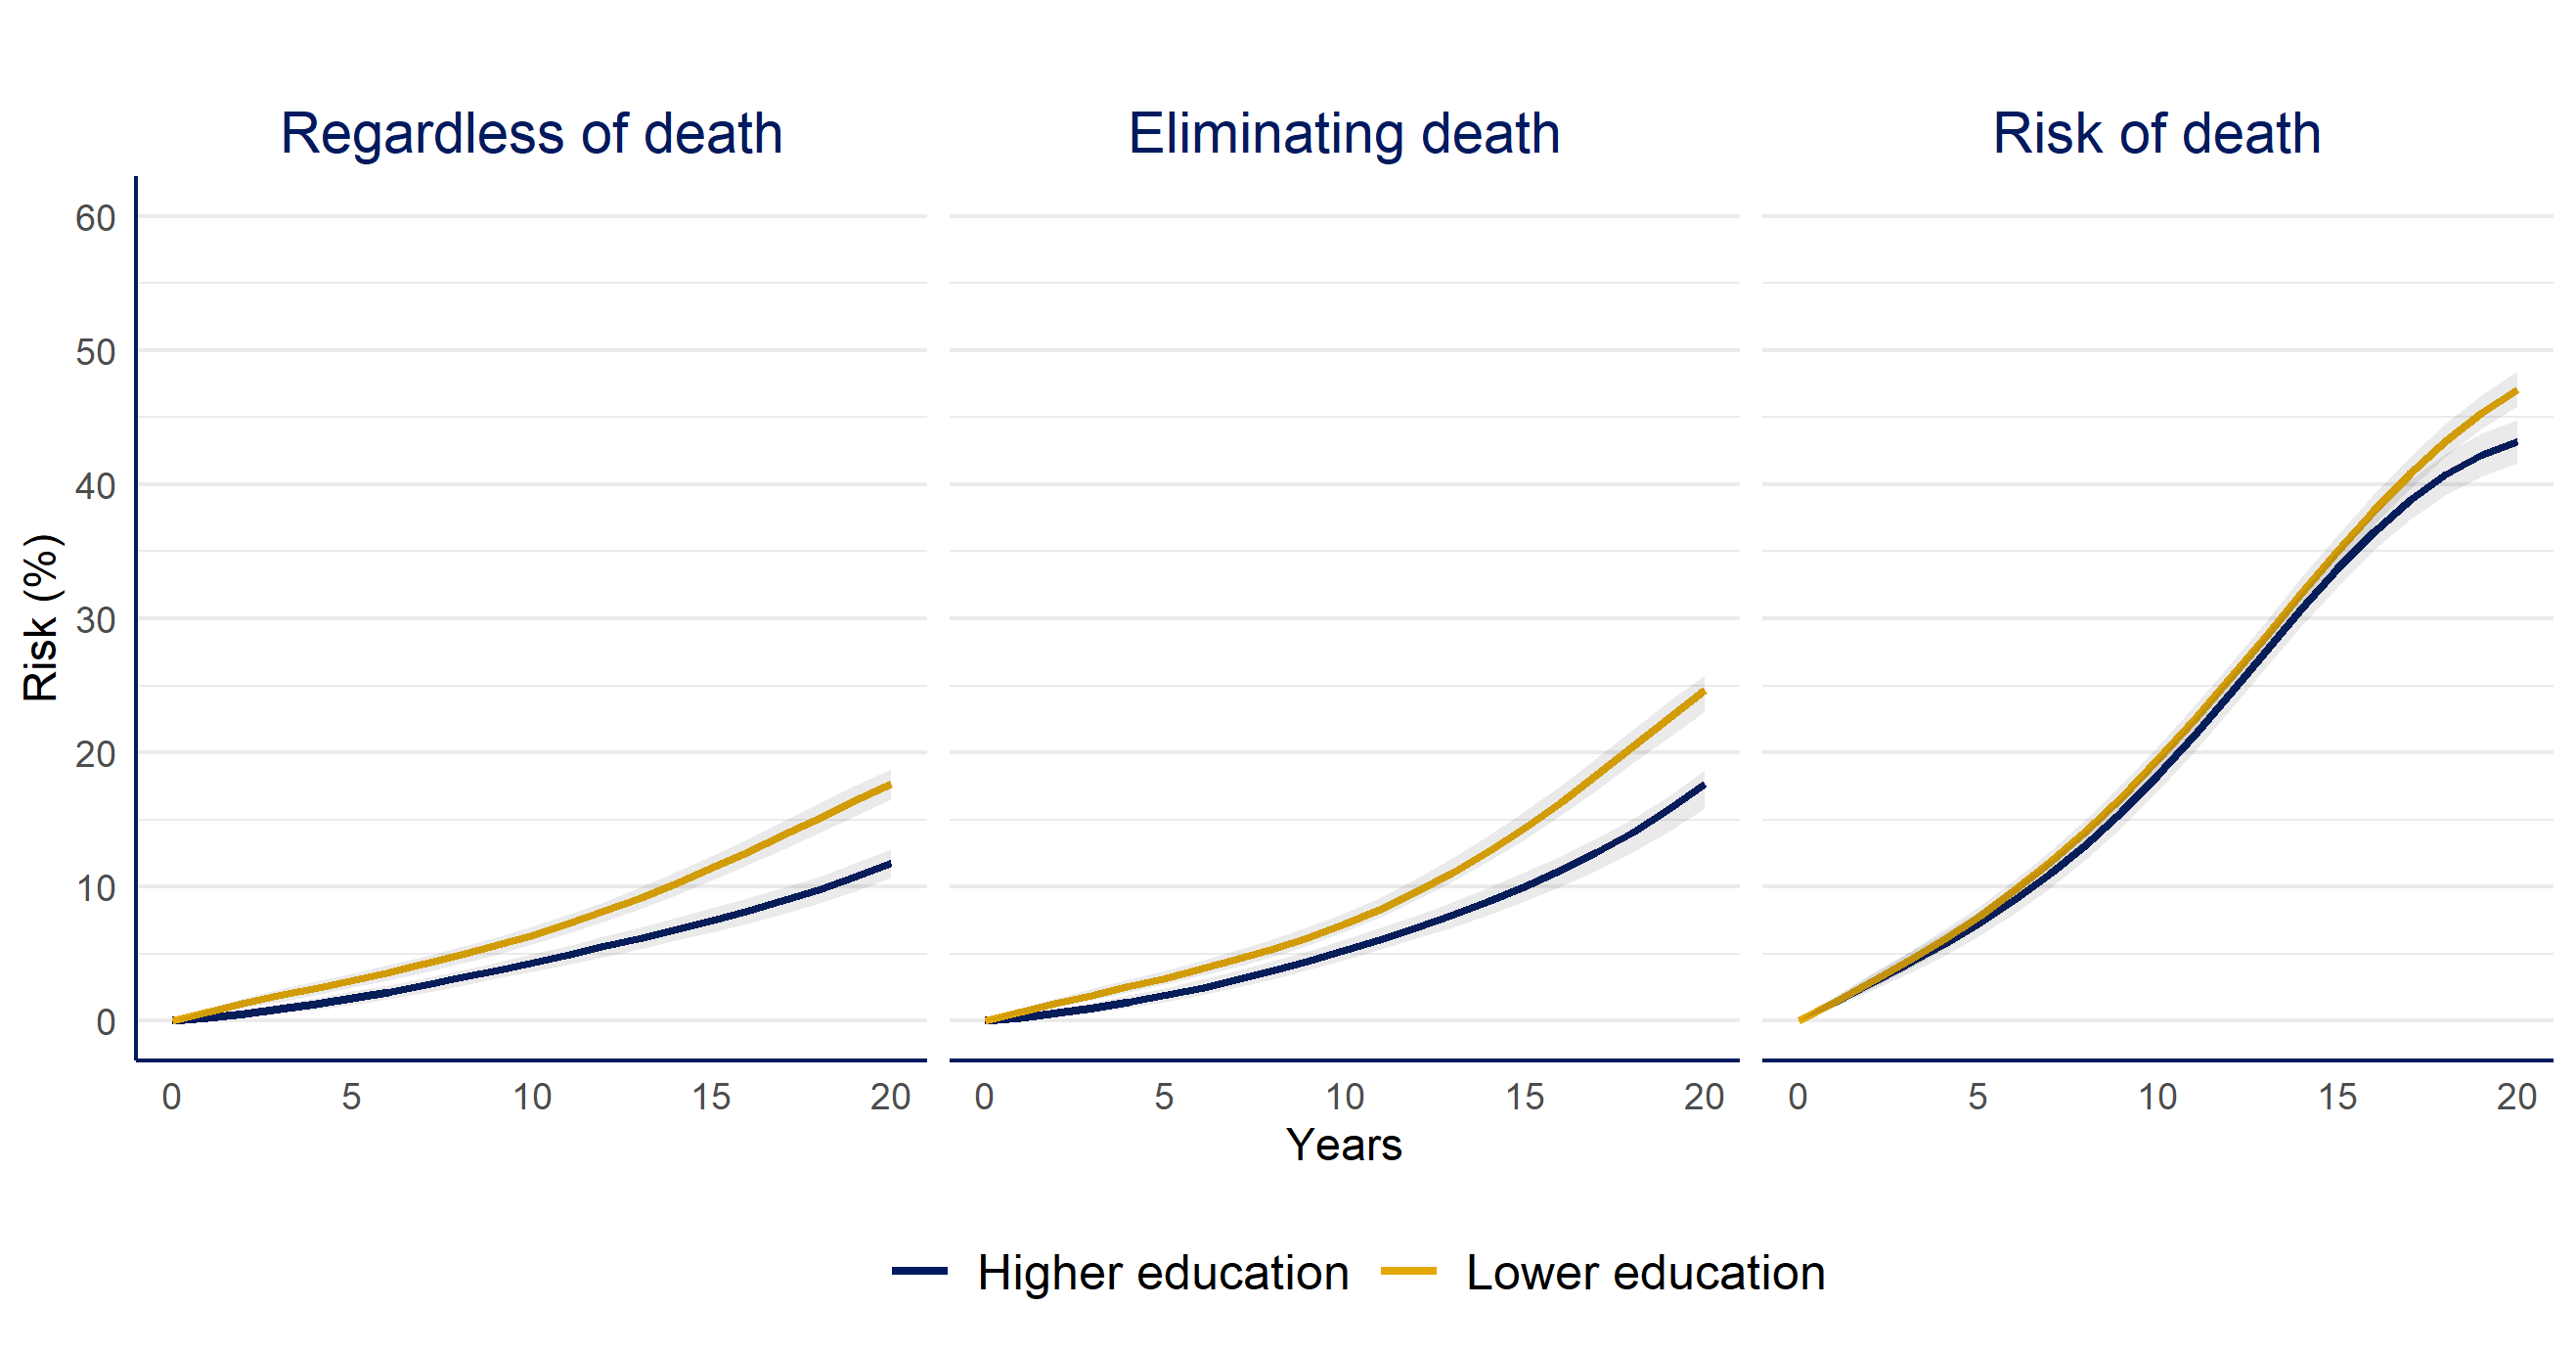
Higher vs. lower educational attainment
| Question | Risk Difference % (CI95%) | Risk Ratio (CI95%) |
|---|---|---|
| Risk of dementia regardless of death | -6 (-7, -4) | 0.67 (0.6, 0.74) |
| Risk of dementia if we eliminate death | -7 (-9, - 5) | 0.72 (0.64, 0.77) |
| Death | -4 (-6, -2) | 0.92 (0.88, 0.96) |
when we compare higher vs. lower educational attainment we observe that individuals with lower education had a higher risk of dementia compared to the higher education group. But risks are similar whether we estimated the risk of dementia with or without elimination of death. Regarding death, the trends are similar and only looks higher by the end of follow up for the lower education group
Women vs. men
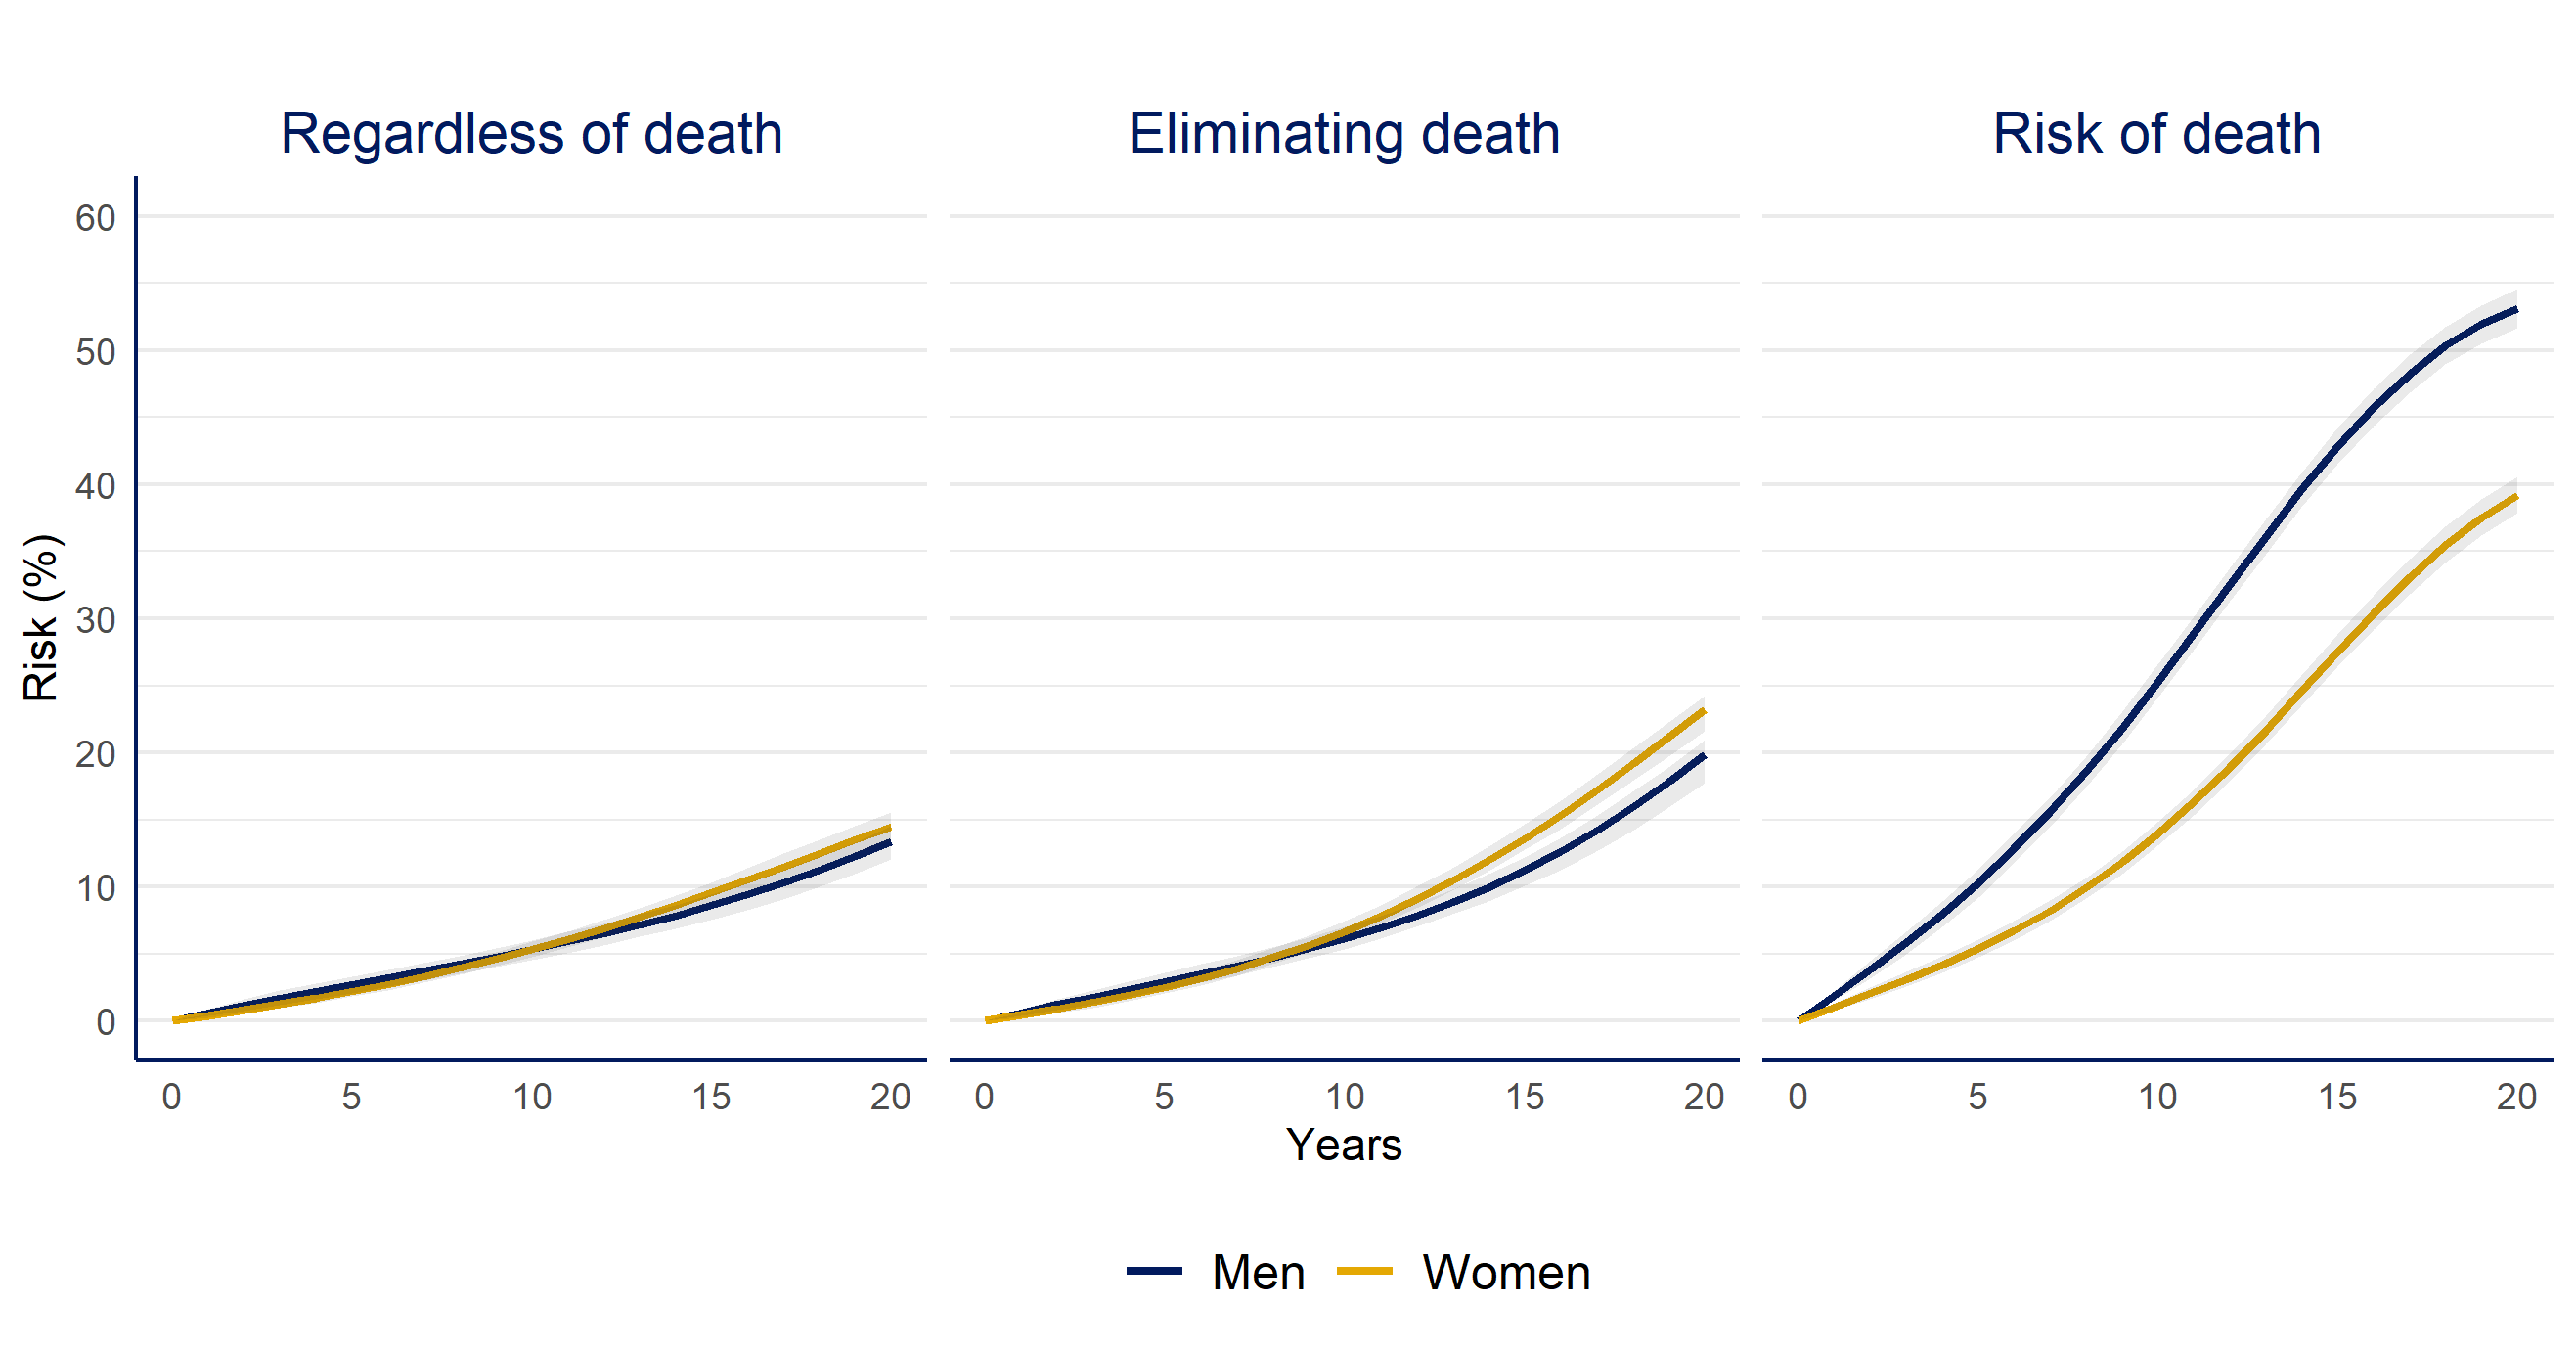
| Question | Risk Difference % (CI95%) | Risk Ratio (CI95%) |
|---|---|---|
| Risk of dementia regardless of death | 1 (0, 3) | 1.08 (0.98, 1.22) |
| Risk of dementia if we eliminate death | 3 (1, 6) | 1.17 (1.07, 1.32) |
| Death | -14 (-16, -12) | 0.74 (0.7, 0.77) |
When we compare women vs. men, Women had an increased risk of dementia compared to men only when we estimate the risk in the hypotethical case we could prevent of death during follow up, men have a higher risk of death over the entire follow up.
APOE-ε4 carriers vs. non-carriers
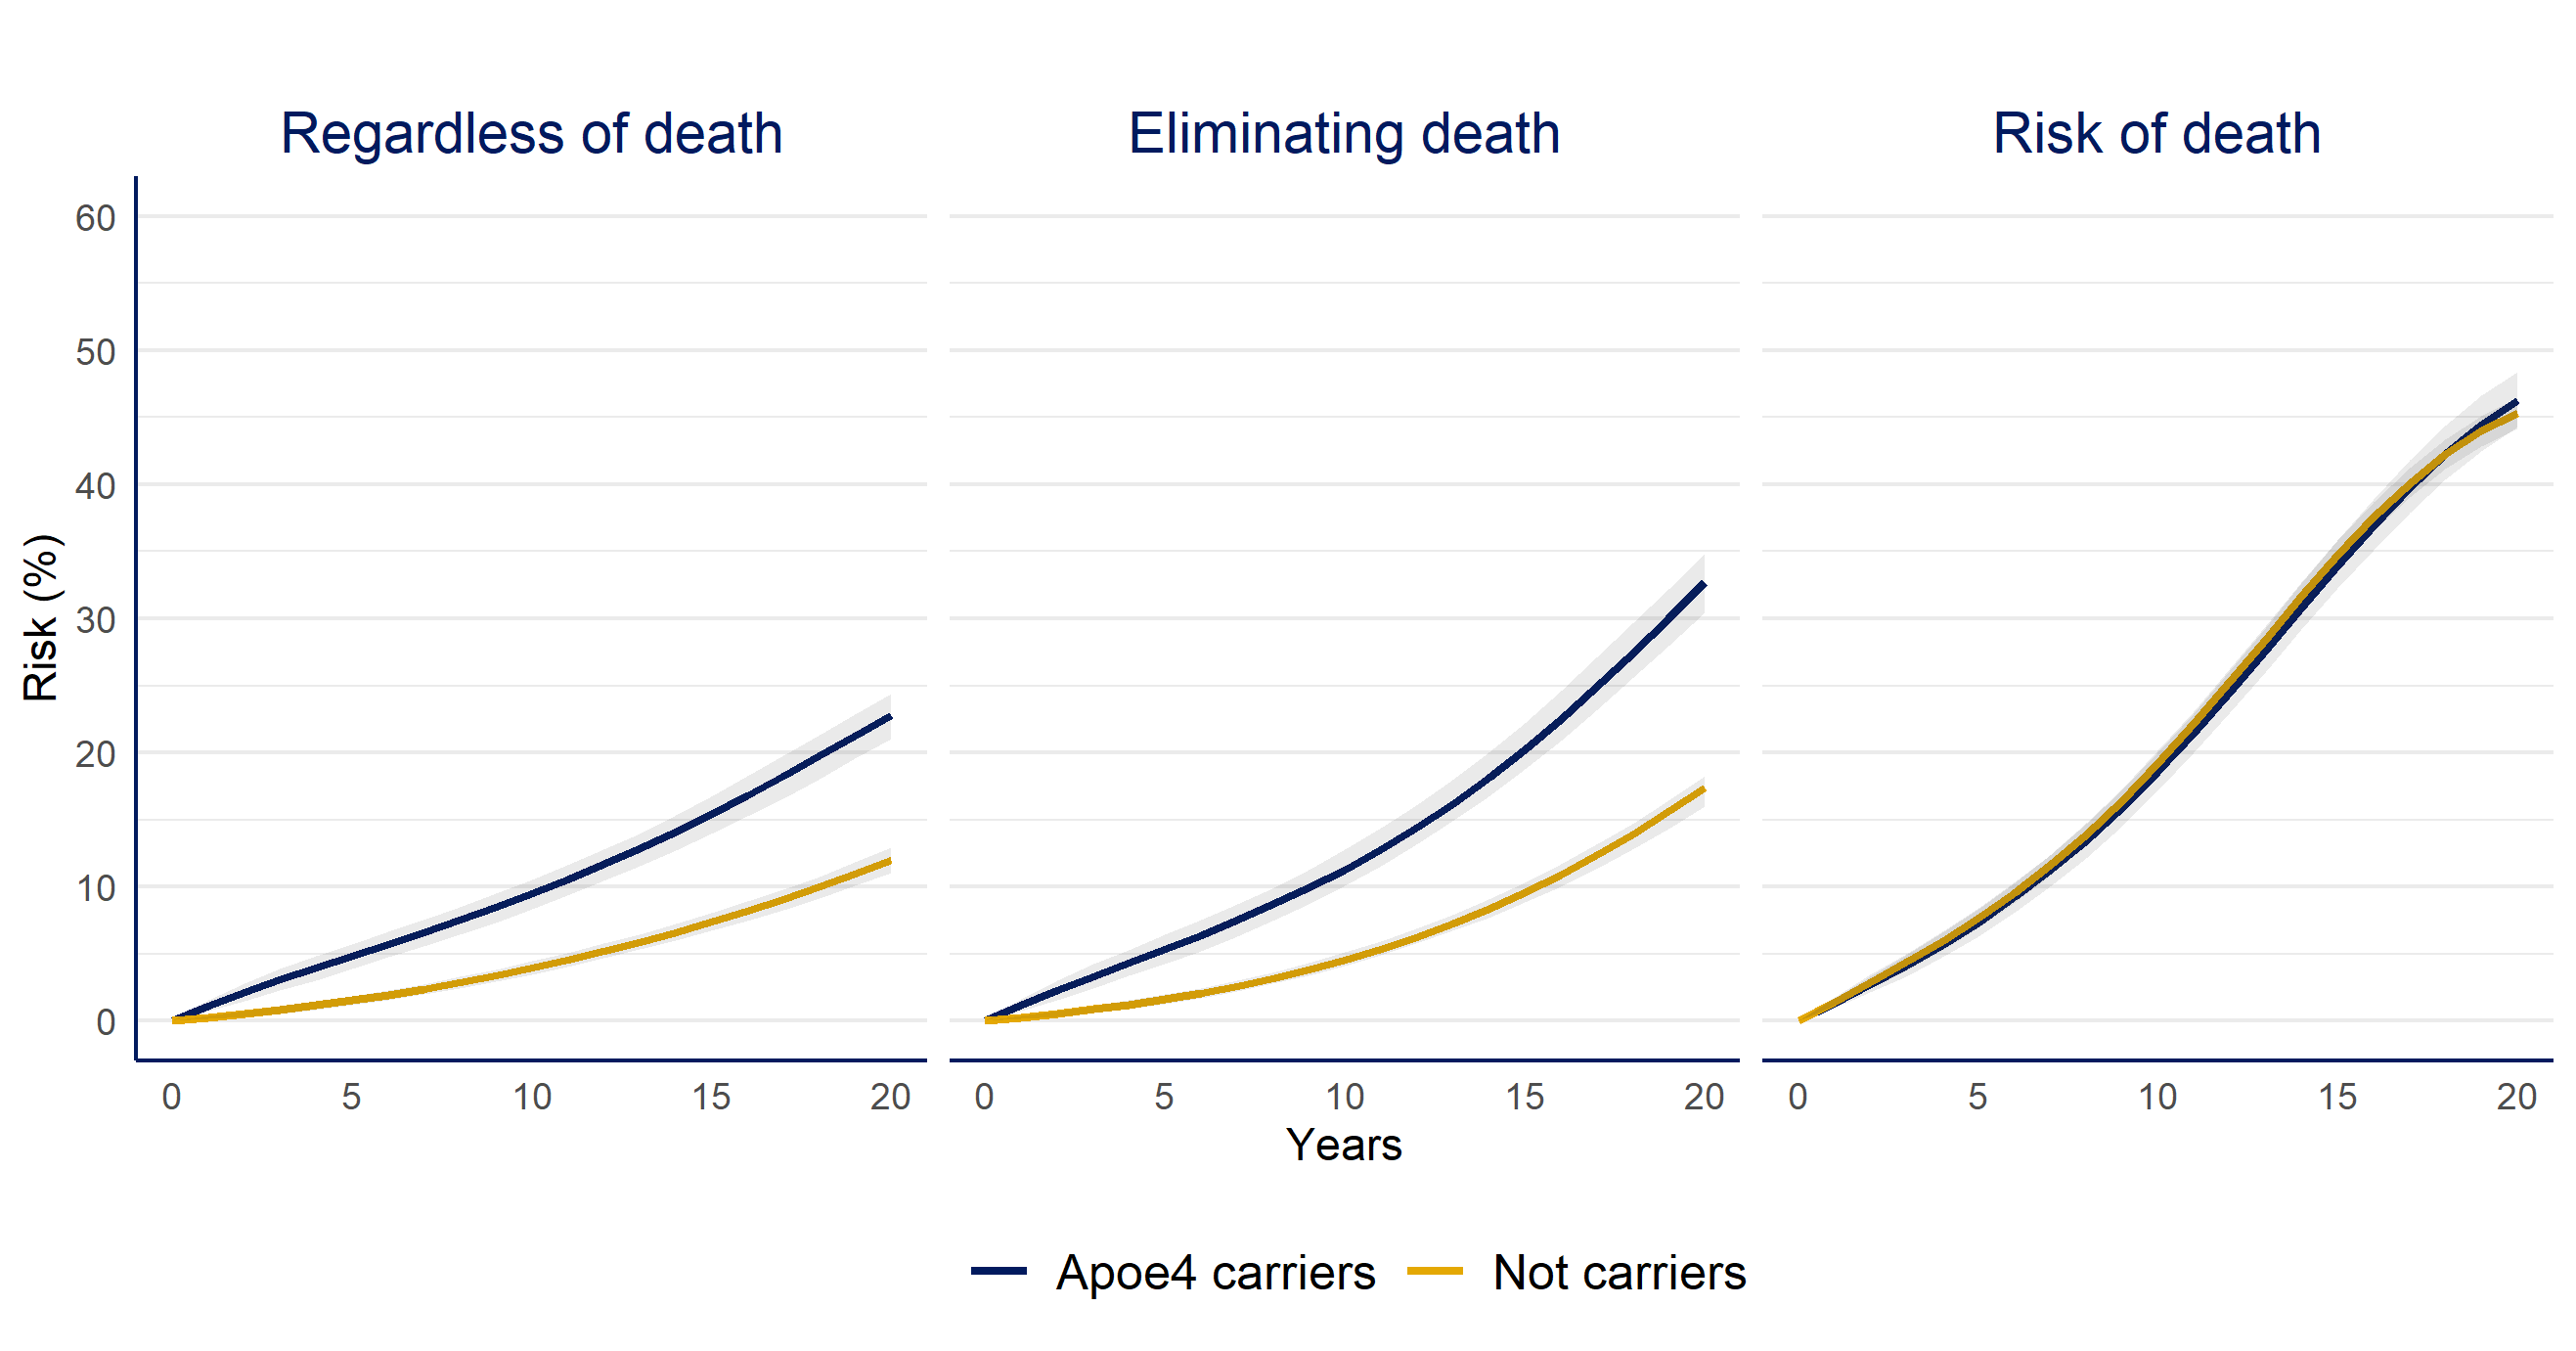
| Question | Risk Difference % (CI95%) | Risk Ratio (CI95%) |
|---|---|---|
| Risk of dementia regardless of death | 11 (9, 12) | 1.9 (1.71, 2.1) |
| Risk of dementia if we eliminate death | 15 (13, 18) | 1.88 (1.74, 2.11) |
| Death | 1 (-1, 3) | 1.02 (0.97, 1.08) |
Apoe4 carriers had an increased risk of dementia compared to the non-carriers, though the difference would be even larger if we could prevent death over time, and the risk of death is similar to both groups over the study period
Systematic review
Searching criteria
Jan/2018 to Dec/2019
Dementia/AD & longitudinal/cohort & hazard/risk
- Alzheimer’s and Dementia
- Annals of Neurology
- BMJ
- Neurology
- JAMA, Jama Neurology
- Lancet, Lancet Neurology
Systematic review
Searching criteria
Jan/2018 to Dec/2019
Dementia/AD & longitudinal/cohort & hazard/risk
- Alzheimer’s and Dementia
- Annals of Neurology
- BMJ
- Neurology
- JAMA, Jama Neurology
- Lancet, Lancet Neurology
Eligibility criteria
Includes time-to-dementia/AD as primary or co-primary outcome
210 selected
78 included
To meet our second aim, we did a systematic review selecting
Results: Systematic Review
Out of 78 papers:
- 53% report death numbers, 12% death by exposure level
53 report how many died over time, only 12 present how many died at each exposure level
Results: Systematic Review
Out of 78 papers:
53% report death numbers, 12% death by exposure level
27% described death as competing event in the methods section
53 report how many died over time, only 12 present how many died at each exposure level
Results: Systematic Review
Out of 78 papers:
53% report death numbers, 12% death by exposure level
27% described death as competing event in the methods section
- 88% present hazard ratios, 85% use Cox PH models
53 report how many died over time, only 12 present how many died at each exposure level
Results: Systematic Review
Out of 78 papers:
53% report death numbers, 12% death by exposure level
27% described death as competing event in the methods section
88% present hazard ratios, 85% use Cox PH models
Only one paper that used cause-specific hazard model mentioned the assumption of uninformative censoring
No paper interpreted the risk of dementia if death could be prevented
32% discuss mortality in the discussion
53 report how many died over time, only 12 present how many died at each exposure level
Take-home messages
- When we study time-to-dementia, death needs to be considered as part of the question.
Take-home messages
When we study time-to-dementia, death needs to be considered as part of the question.
Pick your question wisely. If your results can impact clinical or public health decisions, stick to this world*.
*Andersen PK & Keiding N. Stat Med. 2012
Take-home messages
When we study time-to-dementia, death needs to be considered as part of the question.
Pick your question wisely. If your results can impact clinical or public health decisions, stick to this world*.
*Andersen PK & Keiding N. Stat Med. 2012
- Evaluate assumptions and interpret results carefully
Take-home messages
When we study time-to-dementia, death needs to be considered as part of the question.
Pick your question wisely. If your results can impact clinical or public health decisions, stick to this world*.
*Andersen PK & Keiding N. Stat Med. 2012
Evaluate assumptions and interpret results carefully
In any case, explore the relation between your exposure and death
Collaborative work between clinical researchers, epidemiologists and statisticians should narrow the gap between methods development and applied research
Acknowledgments
Sonja A. Swanson
M. Arfan Ikram
Jessica G. Young
Vanessa Didelez
Mats J. Stensrud
Causal inference team EMC
Neuro epi team EMC
I look forward to discuss in more detail about the questions and methods of this study over chat or you can contact me by email or twitter. The code for this project is at my github repo